


What happens to fluid properties near the critical point?
The case of CO2
The topic exposed in the title arises many questions that we will try to answer in the following paragraphs. Among those, what is the critical point? Is it a state that regards all the fluids? If yes, why do we talk always about CO2?
All of these questions are pertinent and interesting, they need to be discussed and answered in order to clarify an important topic, which is linked to the daily design process of the components of a refrigerating and air conditioning system.
Starting from the first question, the critical point is the last point in which vapour and liquid coexist; in other words, it is the vertex of the saturation curve, the last point where we might have a change of phase from vapour to liquid and vice versa.
The critical point is characterized by a temperature, named critical temperature (tc) and by a pressure, named critical pressure (pc). This definition does not refer to a certain fluid; all fluids have a critical point. For CO2 the critical point is characterized by tc=30.978 °C and pc=73.773 bar.
It is clear that this low value of critical temperature, which is close to the summer ambient temperature in a temperate climate, implies the impossibility of heating rejection from a refrigerating cycle using a condenser because, at 35 °C a 40 °C, the CO2 is already gaseous. This is the reason why this topic is much more interesting for CO2 rather than other refrigerants. The carbon dioxide used in transcritical cycle will operate in a region near to the critical point.
Figure 1 shows the thermodynamic states of carbon dioxide (CO2), plotted in the p-h diagram. The saturation curve is plotted in red, under this curve liquid and vapour coexist; on the left side (blue region) of the curve, only liquid is present and on the right side (green region), only vapour can be found. Above the critical point, there’s a region characterized by a thermodynamic state named Supercritical (pink region) where the fluid is in gaseous phase.

Figure 1. p-h diagram for CO2
In the CO2 transcritical cycle, it is possible to operate nearby to the critical zone where the thermophysical properties of the fluid suddenly changes. This topic cannot be neglected during the design of a heat exchanger, called gascooler, where the supercritical carbon dioxide from the compressor is cooled down before it reaches the throttling device.
The thermophysical properties that controls the heat transfer capabilities of a refrigerant are: the specific heat capacity at constant pressure, the thermal conductivity, the dynamic viscosity and the density.
The first three properties permits the estimation of the Prandtl number, a dimensionless parameter, which is used in the correlations for the calculation of the heat transfer coefficients.
An interesting analysis can be carried out with reference to the density (see figure 2): at the critical point, the liquid and vapour densities have the same value of 467.6 kg m-3, the variation of the density around the critical point is very high.

Figure 2. Supercritical carbon dioxide density as a function of the pressure and temperature. The dotted line indicates the critical temperature.
Figure 2 shows the density as a function of the temperature when increasing the pressure from 75 bar (nearby critical pressure) to 120 bar. The density turns from around 700 kg m-3 to around 300 kg m-3 in 8 K; as the pressure increases, the density variation lowers and for pressures greater than 100 bar, it becomes smooth.

p-h diagram for carbon dioxide
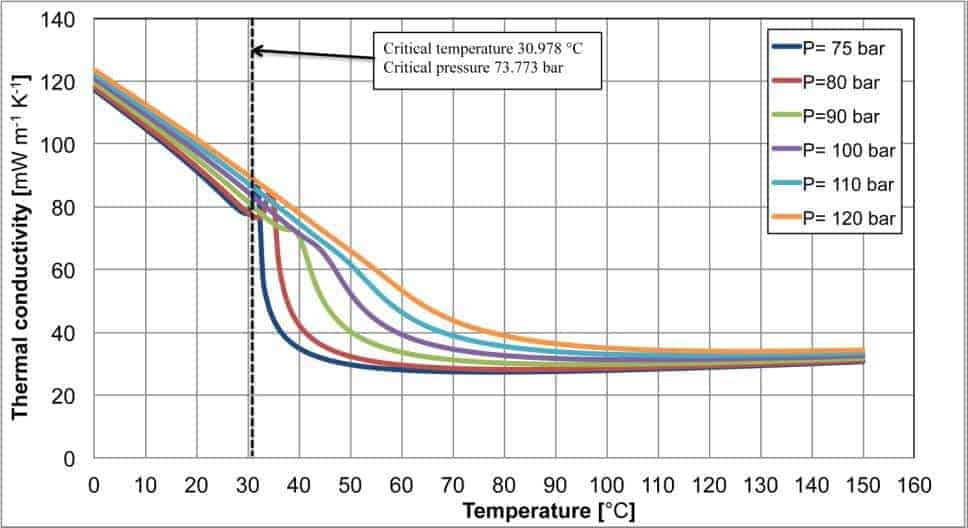
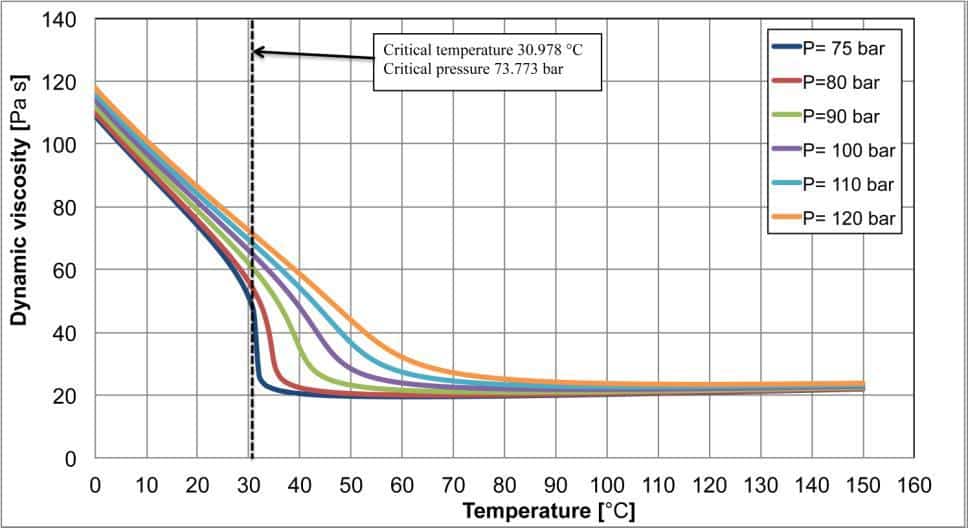
Figure 3. Specific heat at constant pressure, thermal conductivity and dynamic viscosity for carbon dioxide as a function of the temperature and pressure. The dotted line indicates the critical temperature.
Figure 3 shows three diagrams related to the three thermophysical properties linked to the heat transfer process: the specific heat at constant pressure, the thermal conductivity and the dynamic viscosity, as a function of the temperature and pressure.
Starting from the specific heat at constant pressure, this property presents several peaks at different temperatures as a function of the pressure. The peak temperature is called “pseudo-critic temperature”. As the pressure increases, the peaks intensity decreases and the peak temperature increases. Furthermore, as the temperature increases, the specific heat at constant pressure becomes almost constant and it is only weakly affected by the pressure.
This high gradient of the specific heat must be considered during the gascoolers’ design; the heat flow rate q is proportional to the CO2 mass flow rate , to the specific heat at constant pressure cp and to its temperature variation as given by the following equation:
![]()
Considering a gascooler where a fixed mass flow rate of carbon dioxide is cooled down from 120°C to 25 °C at constant pressure of p= 80 bar (red line in figure), the specific heat at constant pressure can be considered constant up to t=100 °C: in this region, the CO2 rejects the same amount of heat when its temperature decreases of 1 °C. After that, the cp starts to rise, slowly at first, then sharply, at 100 °C the cp= 1.33 kJ kg-1 K-1, at 50 °C it is equal to cp= 2.51 kJ kg-1 K-1 and it reaches a maximum value of cp= 29.59 kJ kg-1 K-1 at t=35 °C, then sharply decreases down to cp=2.97 kJ kg-1 K-1 at t=20 °C. In this region, the heat flow rate exchanged for a temperature variation of 1 °C changes with CO2 temperature: at first, it increases from 100 °C to 35 °C and then it decreases till 20 °C. This behaviour must be taken into account during the gascooler design.
The thermal conductivity (second diagram of figure 3) also shows some peaks, which are noticeable for pressure lower than 100 bar with a lower intensity than the ones shown by the specific heat at constant pressure. As the pressure increases, the thermal conductivity variations become weaker and the effects of the critical region completely disappear. In the last diagram of figure 3, the dynamic viscosity is plotted as a function of the temperature and pressure. In this case, there are no peaks, but for pressures close to the critical one there are sudden variations of the dynamic viscosity with a behaviour similar to that described for the density.
From this brief analysis, it clearly appears that it is not possible to consider the thermophysical properties nearby the critical point constant. The sudden variations and the peaks can lead to unmanageable error during the transcritical heat exchangers’ design. Particular attention must be dedicated to the carbon dioxide, which operates in transcritical cycles, often nearby the critical region.
Correlated topics
Transcritical cycle for refrigerating application: the optimum pressure.
Carbon Dioxide as refrigerant (Newsletter no. 1 October 2012)
CO2 heat pumps: from the condenser to the gascooler


